Logging in to your Partner Portal today, you may have noticed a small change. That’s right – we’ve been hinting at it for weeks and it’s finally here. The partner dashboard is live and ready to show you everything you need to know about just how engaged your clients are.
myprosperity has always been about empowering advisers to help their clients get their finances sorted. We do this by presenting a client’s entire – consolidated – financial world in one place. Beyond providing better advice, accountants and planners leverage the platform’s multiple features to drive client engagement and get valuable insights into their customers’ financial needs and wants.
530 Partners use myprosperity primarily for this reason, and they’ve rolled it out to over 23,000 clients. As a result, we’re tracking over $30B in assets and $6B in liabilities. That’s a lot of potentially fascinating data points on both a macro and practice level. So we wondered – how do we package this data into a single snapshot? We create a dashboard, of course.
There were some challenges in putting a dashboard like this together. What data do we display? How do we display it in digestible chunks? Where do we even start?
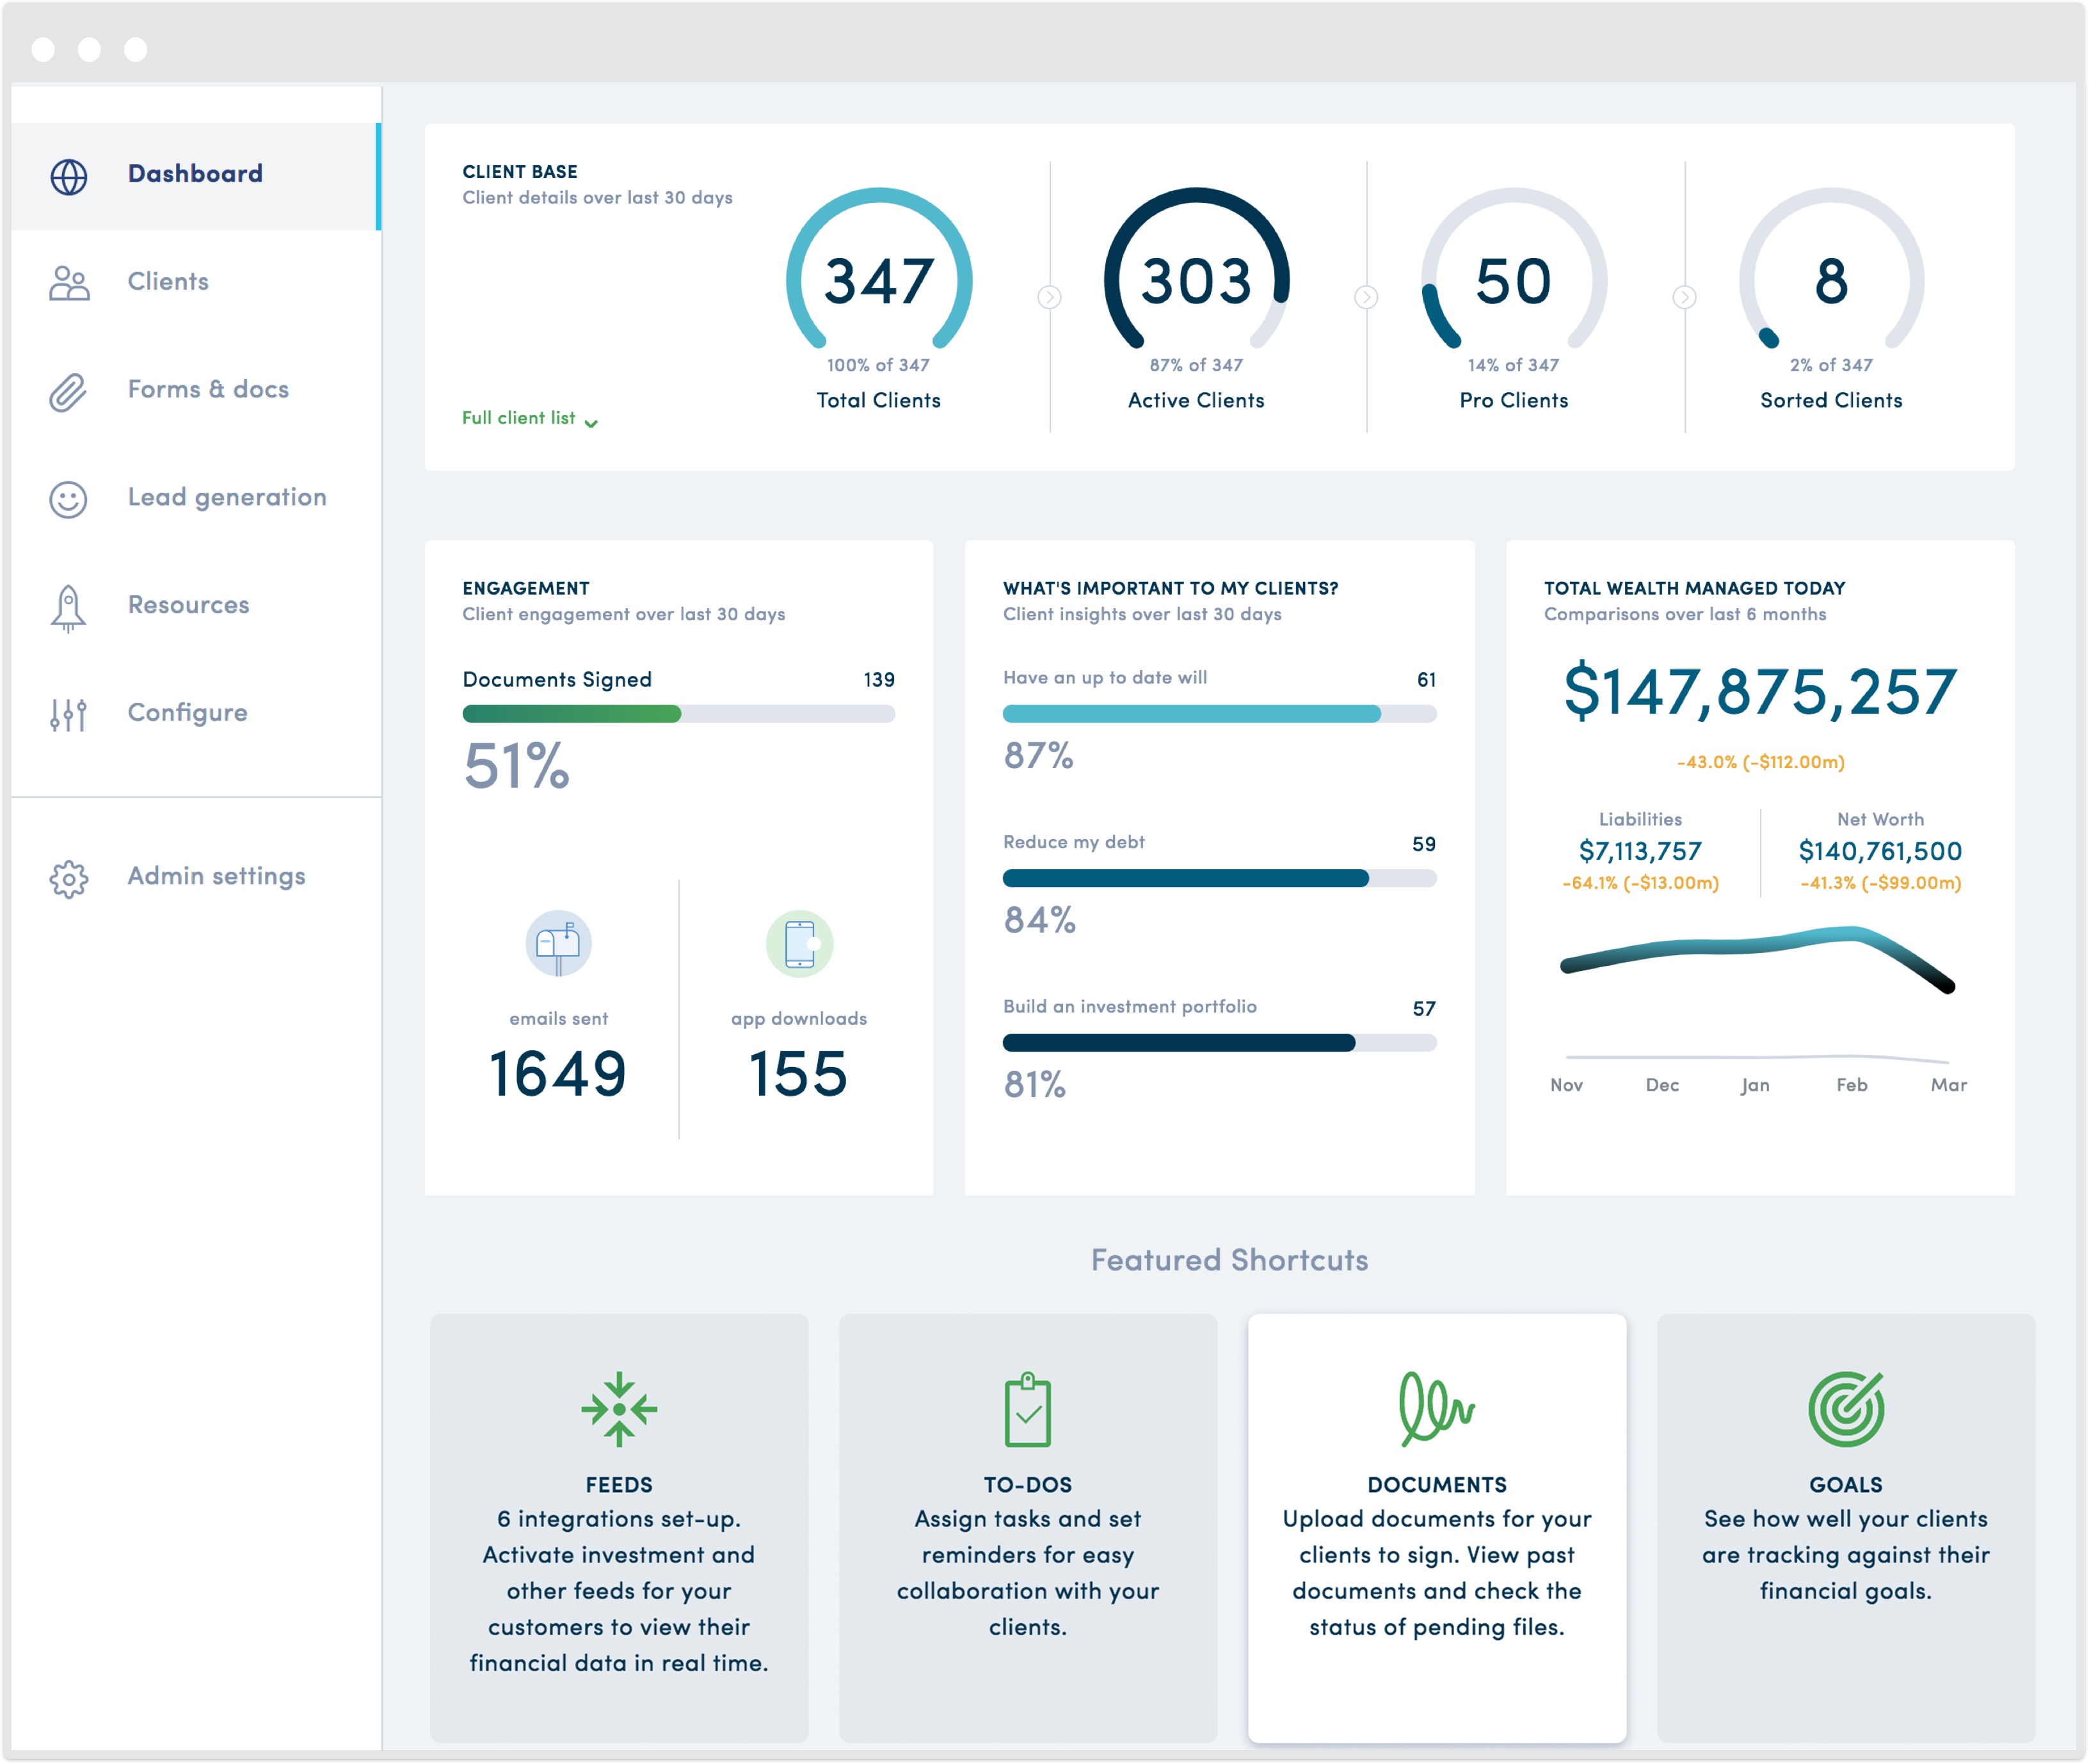
We decided to focus on the basics. Since Partners are using myprosperity to generate business efficiencies and engage with their customers, we started by surfacing the data we have for every single firm that shows them exactly that. In essence, that means:
- The assets and liabilities your firm is tracking.
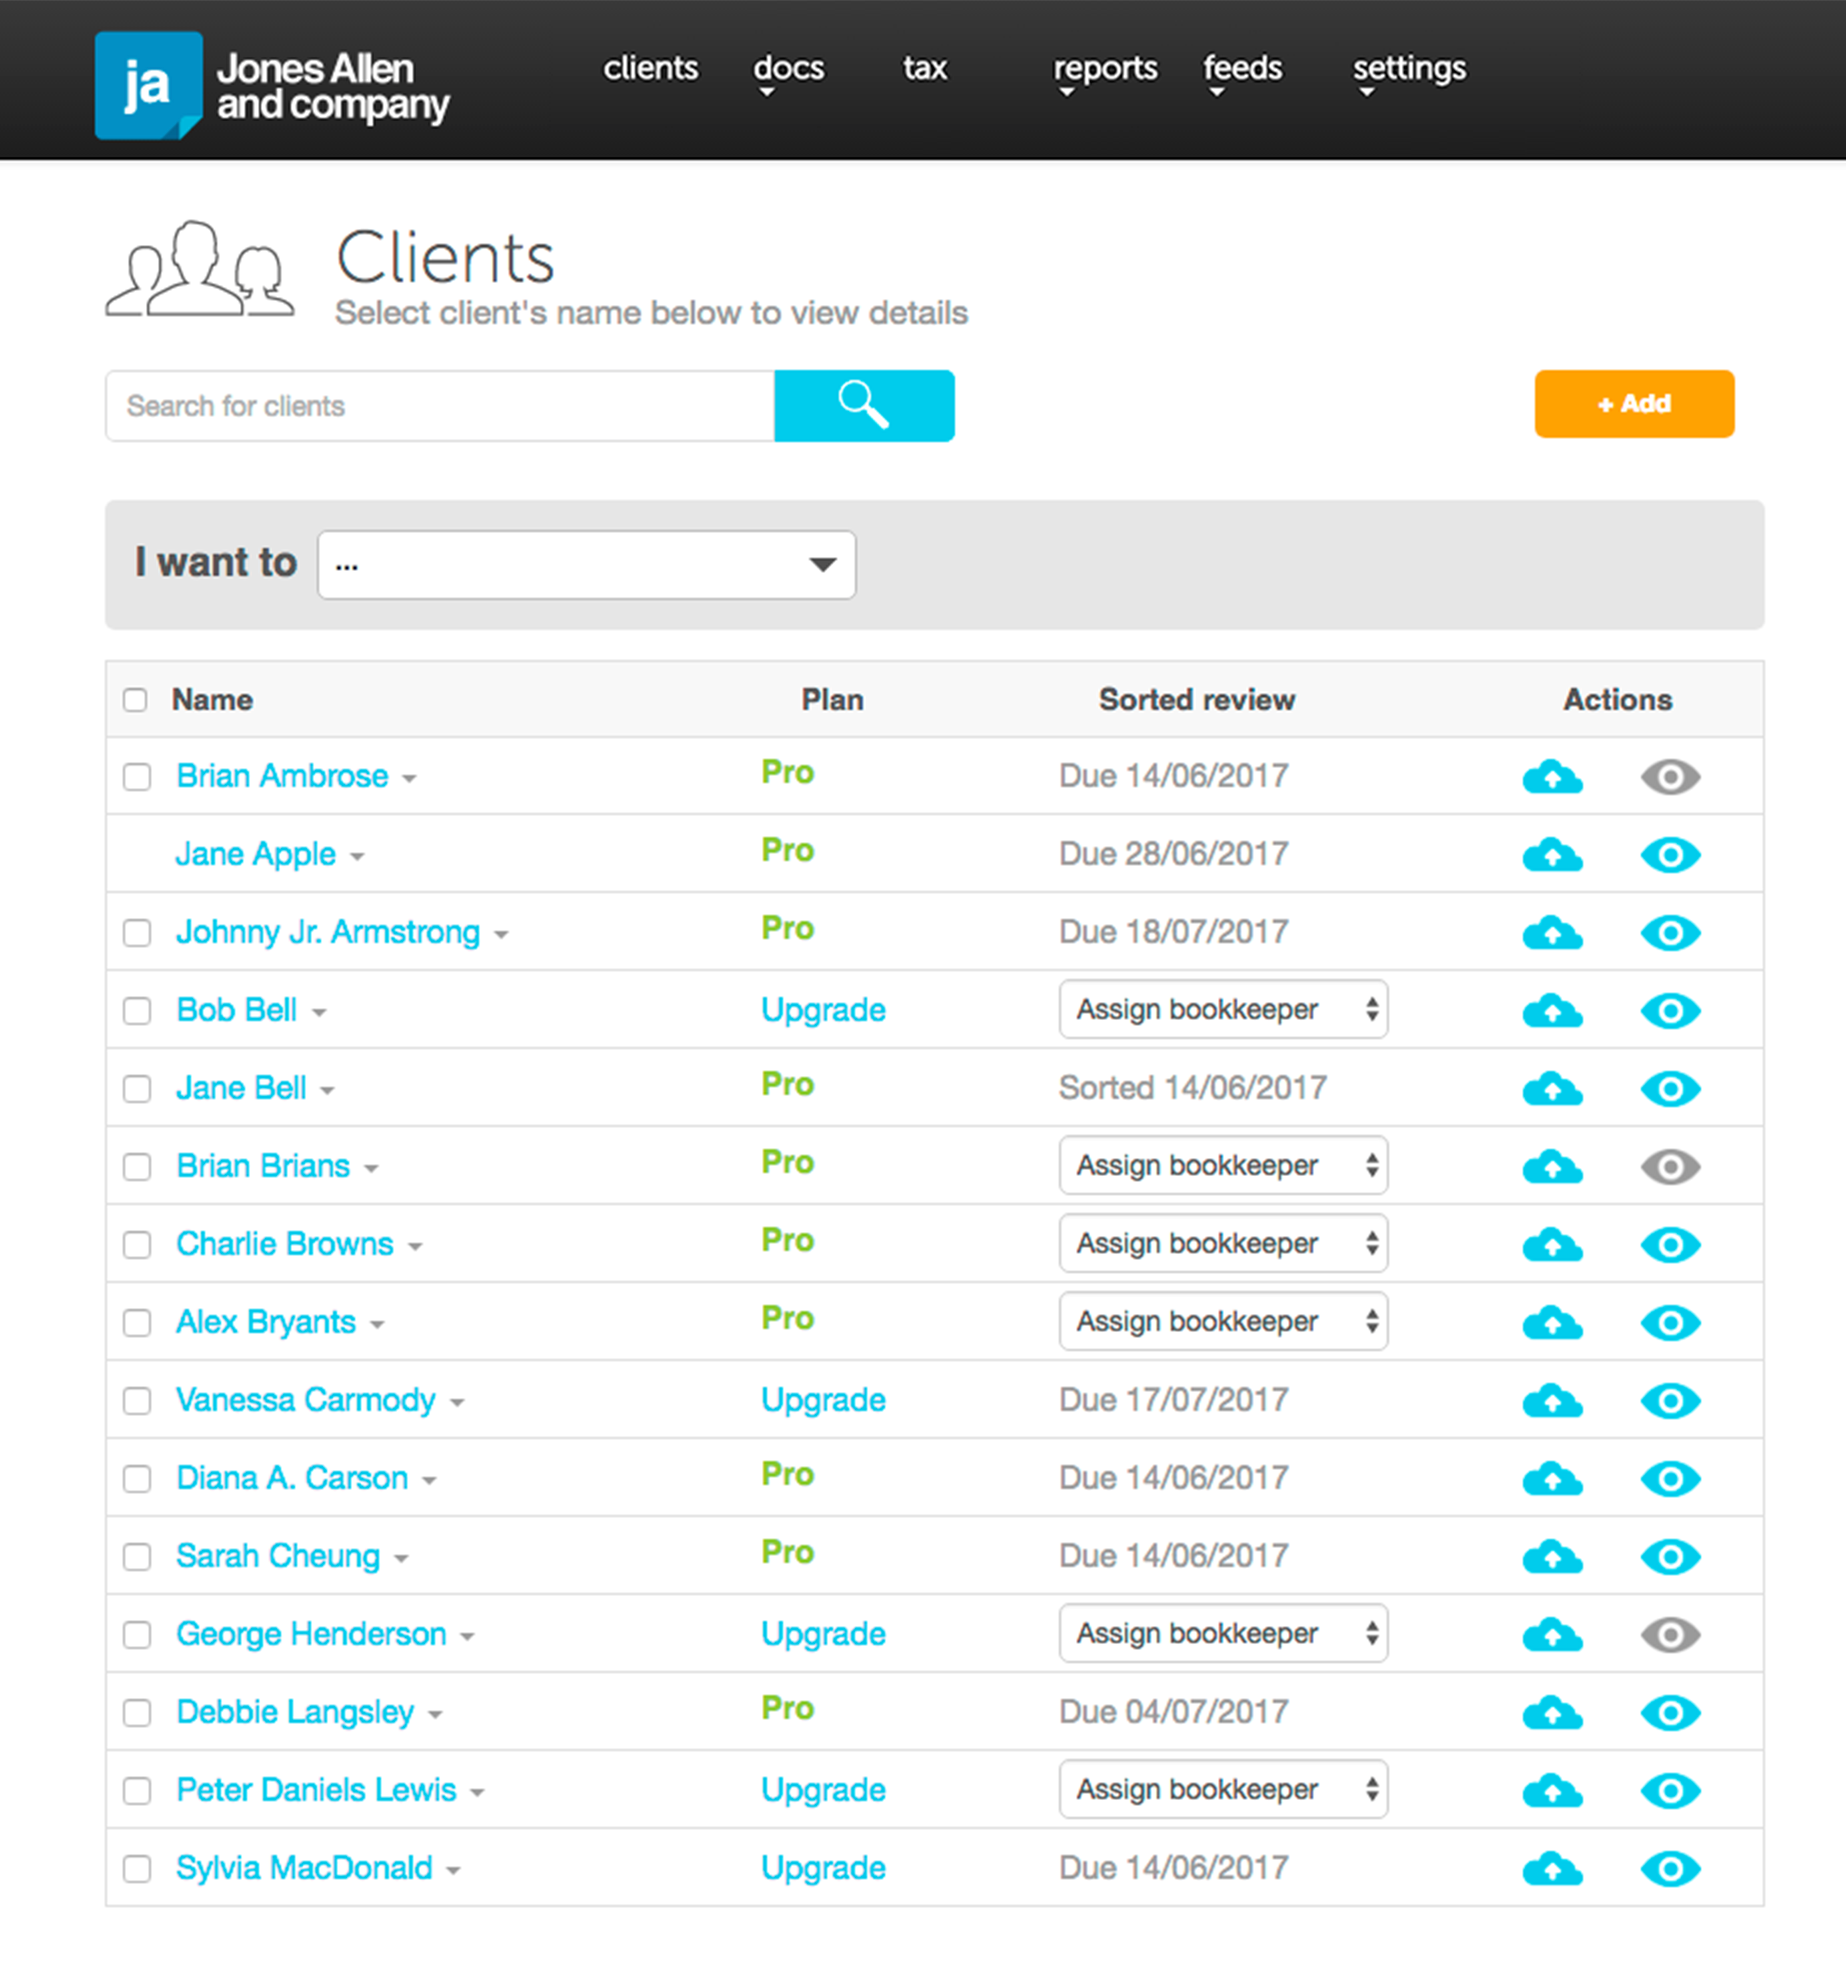
- A breakdown of your myprosperity client list, including those on Pro vs Starter accounts.
- A measure of your clients’ engagement levels, from the number of digital documents signed to the number of app downloads.
- A highlight of the financial concerns most relevant to your clients – information you can use to provide those clients with the assistance they need.
Of course, the more clients you have on myprosperity, the better the data. Whether they’re on the (free) Starter subscription or are paying for Pro, having all your clients on the platform will give you the most comprehensive snapshot.
Our vision is to create one view for an adviser to see exactly what is going on across their entire client base. This has been a journey, starting with showcasing a single client’s financial world and now presenting that data on aggregate at a firm level to help drive strategic decisions. And this is just the beginning.
We are now tracking asset values per item per day, which means we can start producing more detailed analytics and drill down on things like what the biggest asset classes are across your customer base. Or how the value of those assets is evolving over time, which could inform things like whether these are good or bad investments. We’re also looking at layering machine learning algorithms to set alerts and goals at both firm and adviser levels when certain thresholds are reached. The possibilities are endless.
We’ve come a long way and we’ve got many more exciting updates planned for this year. With the dashboard came a few significant changes to the look and feel of the platform, which we’ll continue to improve on, not just in the Partner Portal but in the Client Portal as well.
Log in to your portal, check the dashboard out and let us know what you think – we’re keen to get your feedback. And if you need any help getting started, our Enablement Team is on hand to assist. They’ll help you come up with a strategy for how to roll out myprosperity, and make it part and parcel of your business processes.
After all, the only way to grow your business is to understand your customers – what they need, what they want. And the best indicator of that is how engaged they are. If you can supplement the information you’re getting from day to day conversations with them with firm level insights, just imagine the possibilities.
Onwards and upwards!